

For the first time, this report can say what happened over a month rather than what the book looks like today. The answer is that asking prices on Phuket homes barely moved at all. Between 4 September and 1 October, 1,801 rentals stayed on our book throughout, and 1,776 of them are asking exactly what they asked a month ago. On the sale side, 667 listings were there on both dates and three changed price.
What did change is what is on the book. Sixty-five new sale listings, almost all villas and a good share of them expensive, took the sale side up 8.9% net. And one district's rent median jumped by a quarter without a single landlord in it changing their price. Both are worth understanding before anyone quotes a Phuket number at you this autumn.
What we are counting, and what changed in the method
These figures come from our own catalogue: every listing that is available, priced and visible to the public. On 1 October 2026 that is 2,580 listings — 1,848 long-term rentals and 732 for sale. Villas are 84% of it; the rest is houses, a few condominium units and a handful of penthouses.
The September issue could only compare a fortnight, because our database was loaded in one go in July and nothing before that date records what a Phuket home was asking. We have kept a dated copy of the whole book on every run since. This month compares 1 October against 4 September, with the same filter, the same 15-listing floor per slice and the same price bands, so the change you read below is a change in the book and not a change in our arithmetic.
The same two caveats apply. These are asking prices, not recorded sales — Thailand has no public sold-price register, so nobody publishing Phuket data has transaction prices, us included. And a median moves when the mix of listings moves, not only when prices do. This month that second caveat is the whole story in one district, so we have added a like-for-like check: the same listing, on both dates.
The same homes, a month apart
| Rentals | For sale | |
|---|---|---|
| On the book on both dates | 1,801 | 667 |
| Same asking price | 1,776 | 664 |
| Price cut | 14 | 2 |
| Price raised | 11 | 1 |
| Left the book | 45 | 5 |
| New to the book | 47 | 65 |
Two rentals in a hundred changed their asking rent over the month, and the cuts slightly outnumbered the rises. The median of those 1,801 rents is ฿130,000 on both dates, and their combined monthly asking rent fell by 0.1%. On the sale side the 667 continuing listings have the same median, ฿19.7m, on both dates.
The listings that left are a mix, and we cannot tell you which were let, which were sold and which the owner simply withdrew: six are still visible and marked withdrawn, and the other 44 are simply no longer public. "Left the book" is the only honest label. "New to the book" also means new to us, not necessarily new to the market.
Rents by district
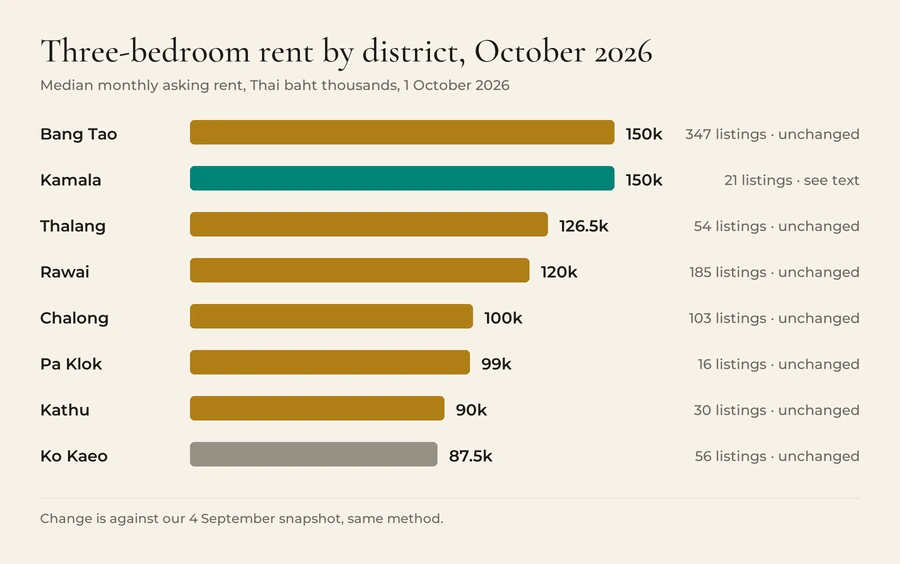
| District | Median rent | Listings | 4 September | Change |
|---|---|---|---|---|
| Bang Tao | ฿150,000 | 347 | ฿150,000 (347) | unchanged |
| Kamala | ฿150,000 | 21 | ฿120,000 (29) | +25.0%, see below |
| Thalang | ฿126,500 | 54 | ฿126,500 (54) | unchanged |
| Rawai | ฿120,000 | 185 | ฿120,000 (185) | unchanged |
| Chalong | ฿100,000 | 103 | ฿100,000 (100) | unchanged |
| Pa Klok | ฿99,000 | 16 | ฿99,000 (16) | unchanged |
| Kathu | ฿90,000 | 30 | ฿90,000 (31) | unchanged |
| Ko Kaeo | ฿87,500 | 56 | ฿87,500 (58) | unchanged |
One correction of language to our own September issue: these medians cover every three-bedroom rental in the district, not villas alone. Villas are 87% of the 850 three-bedroom rentals on the book; the rest are houses and a few condominium units and penthouses. The comparison is like for like because the method is the same on both dates.
Island-wide, the ladder by size is ฿50,000 a month for one bedroom (27 listings), ฿90,000 for two (221), ฿120,000 for three (850), ฿170,000 for four (525), ฿250,000 for five (159) and ฿290,000 for six (46). Two steps moved: two bedrooms up ฿1,000 and six bedrooms down ฿10,000. At those sample sizes neither is a trend.
Kamala: a 25% rise that nobody asked for
Kamala's three-bedroom median went from ฿120,000 to ฿150,000. Not one Kamala landlord did that. The 20 three-bedroom listings that were on the book on both dates are asking exactly what they asked in September. What happened is that nine cheaper ones left — seven of them asking between ฿60,000 and ฿75,000 — and only one came in. Take the bottom of a 29-listing sample away and the middle moves up by itself.
This is the reason we print the listing count beside every median, and the reason a thin district deserves suspicion in either direction. A headline that said "Kamala rents up 25%" would be arithmetically true and wrong about the market. The honest reading is that the cheaper end of Kamala's three-bedroom supply thinned out over September, which matters to anyone looking there at under ฿100,000 a month, and that the landlords who remain have not moved.
The sale side: more stock, more of it expensive
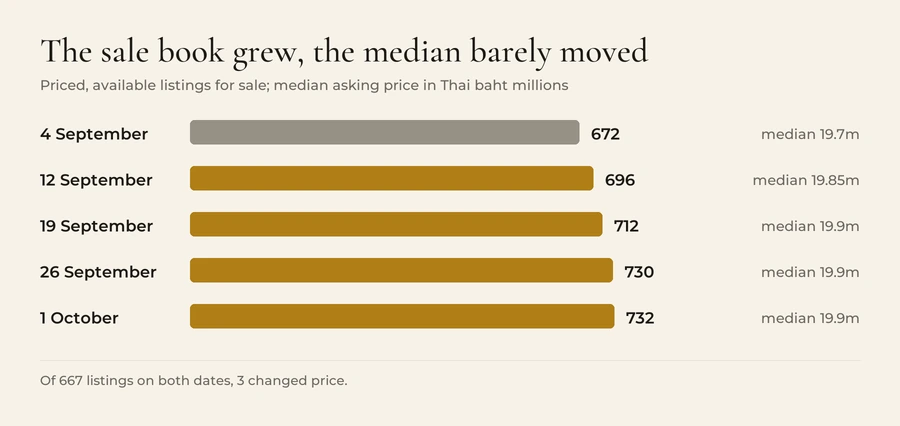
The sale book grew from 672 to 732 listings over the month, steadily rather than in one batch. Sixty-five arrived and five left. The new arrivals are almost all villas — 61 of 65 — and they are dearer than the book they joined: their median asking price is ฿26.9m against ฿19.9m for the whole sale book. Ten of them ask ฿80m or more, which is why that top band grew from 43 listings to 53.
| District | Median asking price | Listings | 4 September |
|---|---|---|---|
| Kamala | ฿35.0m | 27 | ฿35.0m (25) |
| Bang Tao | ฿25.65m | 260 | ฿25.0m (241) |
| Pa Klok | ฿24.95m | 22 | ฿22.95m (20) |
| Thalang | ฿20.4m | 58 | ฿20.4m (52) |
| Kathu | ฿18.75m | 18 | ฿18.0m (17) |
| Chalong | ฿16.9m | 77 | ฿16.8m (77) |
| Ko Kaeo | ฿15.95m | 30 | ฿15.4m (28) |
| Rawai | ฿15.9m | 179 | ฿15.9m (163) |
Every district median that rose did so because of what was added, not because sellers re-priced: across the whole sale book only three continuing listings changed price, two of them down. Bang Tao's 2.6% and Pa Klok's 8.7% are the new villas showing up in the median. Read them as "the stock on offer got dearer", not as "prices went up".
The bottom of the market did not get the same restocking. There are 86 listings under ฿10m, one more than in September, and they are now 11.7% of the sale book rather than 12.6%. A buyer with ฿8m to spend has the same short list they had a month ago, inside a bigger market.
Where the supply is
The concentration we described in September has not moved. Bang Tao is 38.8% of our book, Rawai 22.1% and Chalong 11.2%: those three districts are 72% of everything available. Kamala's share fell from 3.3% to 2.9% as its cheaper rentals left. If you want to see the districts side by side, our district pages carry the live counts, and the Phuket property price index publishes price per square metre by district on the same catalogue.
The demand side, now with a Phuket number
In September we wrote that there was no Phuket-only visitor series for 2026 and used national arrivals as a proxy. That was wrong in a useful way. The Ministry of Tourism and Sports does publish a provincial file each month. It counts visitors staying in the province rather than border arrivals, so it is not the same measure as the national figure, but it is a Phuket figure.
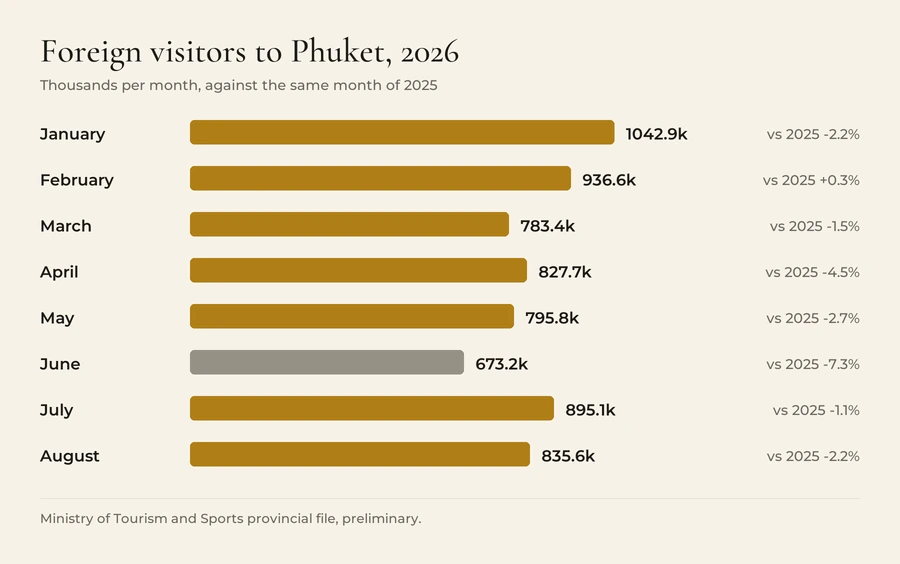
Phuket received 6.79 million foreign visitors in the first eight months of 2026, against 6.97 million a year earlier: down 2.5%. August alone was down 2.3%, at 835,622. February was the only month above 2025. Accommodation occupancy over the eight months averaged 66.2% against 67.6%, although August's occupancy, at 70.0%, was a point higher than last August's.
Nationally, Thailand took 20.94 million international arrivals over the same eight months, down 3.1%. The mix underneath has not changed since September: China up 16.0%, Malaysia down 11.9%, South Korea down 24.8%. The nationalities that tend to sign long villa leases moved very little. Russia is down 0.6%, the United States up 0.9%, the United Kingdom down 3.4% and Germany down 2.1%. The Ministry notes that its national June figure is missing four days because of a data-system outage between 22 and 25 June. The provincial file does not say whether the same gap applies to it, so treat Phuket's 7.3% fall in June with some caution.
Put that next to the rental book and the two are consistent rather than connected: slightly fewer visitors, a slightly softer year for accommodation, and twelve-month asking rents that did not move. A visitor count measures holidays, not leases, and we would not read a 2.5% fall in one as a forecast for the other.
What the official housing data says
Two September releases from the Real Estate Information Center, the Government Housing Bank's research arm, mention Phuket by name, and they are the nearest thing to transaction data the island has.
In the second quarter of 2026, 1,905 second-hand homes changed ownership in Phuket, worth ฿5,890m. That was 4.8% more units than a year earlier and 6.3% more value. Phuket ranked fourth in the country for second-hand transfers. REIC nonetheless names it as the province that has begun to slow (our translation of the Thai release), because its growth was the lowest of the top ten. On the supply side, REIC counted 2,650 second-hand homes listed for sale in Phuket, up 21.1% on a year earlier, with an average asking price of ฿9.3m against ฿8.5m.
Those are REIC's own definitions and REIC's own sample, covering every kind of home and not only villas, so they do not reconcile with our book and should not be made to. They point the same way, though. More stock is coming to market, and it is growing faster than the transactions are.
The Bank of Thailand's residential property price index has no Phuket breakdown. Its southern-region single-detached-house series stood at 151.0 in August, against 152.6 in July, on a 2011 base of 100. That is one month of a regional index, and it is the only official house-price series that comes close to the island.
Money
Nothing changed. There has been no Monetary Policy Committee decision since 26 August, when the Bank of Thailand held the policy rate at 1.00%, unanimously. The next scheduled meeting is on 28 October. The Bank's August statement described growth as low and uneven and expected inflation, now projected lower than before, to rise into early 2027. For a foreign buyer paying cash from abroad, the rate is background. For the Thai developers building the supply above, it is not.
What it means
If you are renting. Almost no landlord on our book moved their asking rent in September — 25 of 1,801, in both directions — and the rental book is the same size it was a month ago. That is a calm market going into the high season, not a soft one. The leverage is still in the terms — lease length, deposit, what is included — rather than the headline figure. If you want a three-bedroom home in Kamala under ฿100,000 a month, the choice is visibly thinner than it was in early September.
If you are buying. More choice, at unchanged prices. Sellers who were on the market in September have, with three exceptions, not changed their price. On our book, at least, sellers are neither cutting to find a buyer nor finding reasons to ask more. A well-argued offer below asking is still a normal conversation. The growth in stock is at the top end, so a buyer above ฿25m has noticeably more — 39 of the 65 new sale listings ask that or more — to look at than a month ago, and a buyer under ฿10m does not.
If you are selling or letting. Your competition on the sale side grew by roughly one listing in eleven over the month, most of it priced above the median. Asking prices are sticky on this island — the evidence is a sale book where more than 99% of sellers did not touch their number in four weeks — so the price you list at is the price you will be compared at for a long time. It is worth getting right on day one.
We will run this again at the start of November with the same method, against this month's snapshot. Browse what is available now, or look through the projects and districts behind these numbers. The September issue, with the fortnight that came before this month, is here.