
Every version of this question we are asked has a hidden second half. "Where is the best area to buy in Phuket" almost always means "best for the thing I have not told you about yet" — an income, a family, a resale in eight years, a place to actually live. Those four buyers should not buy in the same district, and any article that hands them one ranking is selling something.
So here is the ranking done properly: four of them, each built from the same set of numbers, each answering a different question. The data is our own book on 10 September 2026 — 2,536 priced, available listings across Phuket, of which 689 are for sale and 1,847 are long-term rentals. Where a district has fewer than fifteen priced listings we have left it out rather than publish a median resting on four properties.
What we counted, and what we did not
This matters more than the ranking, so it goes first.
Every figure below is an asking price from our own catalogue. It is what a property is listed at, not what it sold for. We do not have transaction data — nobody in Phuket has a reliable public record of achieved prices — so where this article says a district is cheaper, it means sellers there are asking less. That is genuinely informative, because asking prices are where negotiation starts. It is not the same as a sold price, and we are not going to pretend otherwise.
The same caveat, harder, applies to yield. We report an implied gross yield: the median annual asking rent in a district divided by the median asking price for a comparable property in the same district. Two different pools of property, before agency fees, maintenance, management, insurance, tax, or a single empty month. It is a useful way to compare districts against each other. It is not the return you will bank, and it is not a realised yield — we have no dataset of signed leases against purchase prices, and any figure we published claiming to be one would be invented.
One thing does work in our favour here: 1,819 of the 1,847 rental listings carry a twelve-month minimum lease, so annualising the monthly figure is honest rather than a holiday-let fantasy dressed up as income.
The eight districts, side by side
These are the districts with at least fifteen priced sale listings on our book. Together they carry the overwhelming majority of what is actually available.
| District | Sale listings | Entry (25th pct) | Median asking | Per built m² | Rental listings |
|---|---|---|---|---|---|
| Bang Tao | 241 | ฿16.7m | ฿25.0m | ฿88,000 | 735 |
| Rawai | 169 | ฿12.5m | ฿15.9m | ฿69,000 | 388 |
| Chalong | 78 | ฿12.9m | ฿16.6m | ฿58,000 | 208 |
| Thalang | 54 | ฿15.0m | ฿20.9m | ฿69,000 | 90 |
| Ko Kaeo | 29 | ฿13.9m | ฿15.9m | ฿61,000 | 125 |
| Kamala | 27 | ฿8.6m | ฿35.0m | ฿105,000 | 55 |
| Pa Klok | 21 | ฿16.5m | ฿24.0m | ฿67,000 | 45 |
| Kathu | 16 | ฿13.9m | ฿16.9m | ฿54,000 | 70 |
Read the Kamala row with suspicion, and we will come back to why.
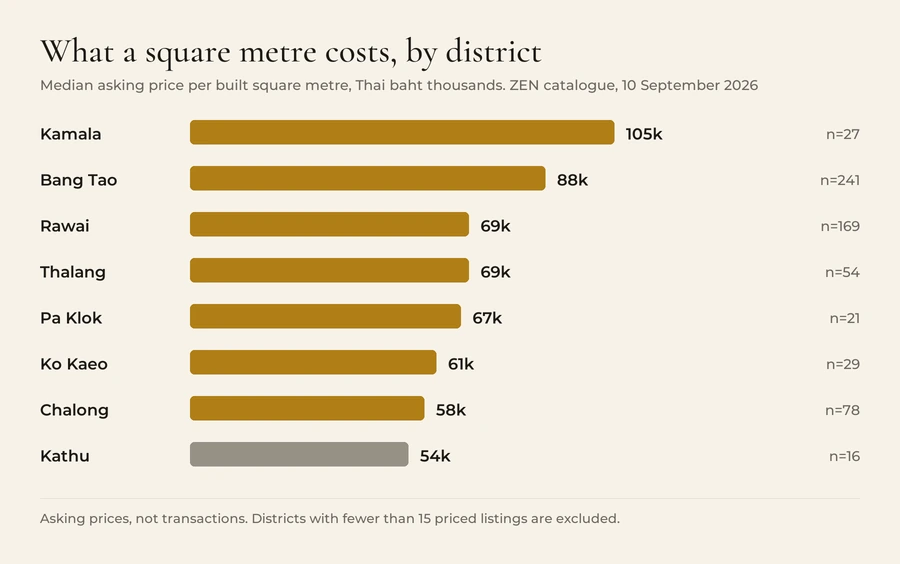
The spread is the story. A square metre in Kamala asks roughly twice what one in Kathu asks. Both are on the same island, twenty-five minutes apart.
Ranked one: if you want the most space for the money
Kathu, then Chalong.
Kathu is the cheapest built square metre on our book at about ฿54,000, and it also carries the largest median villa — 390 m² against Rawai's 280 m². That combination is the whole argument for the district: it is the valley behind Patong, inland, not a beach address, and the market prices it accordingly. Sixteen sale listings is a thin sample and we will not pretend it is more, but the direction is consistent with the rental side, where 70 listings sit at a median of ฿117,500 a month.
Chalong is the same trade with a deeper book: 78 sale listings at ฿58,000 per square metre, a median asking price of ฿16.6m, and 208 rentals behind it. It is the practical middle of the island — schools, the boatyards, the bypass — and it consistently prices below the coast for property that is not meaningfully smaller.
What you give up in both is the beach walk, and with it the top of the rental market. Neither district has a ฿400,000-a-month tenant in it.
Ranked two: if you want income
Rawai.
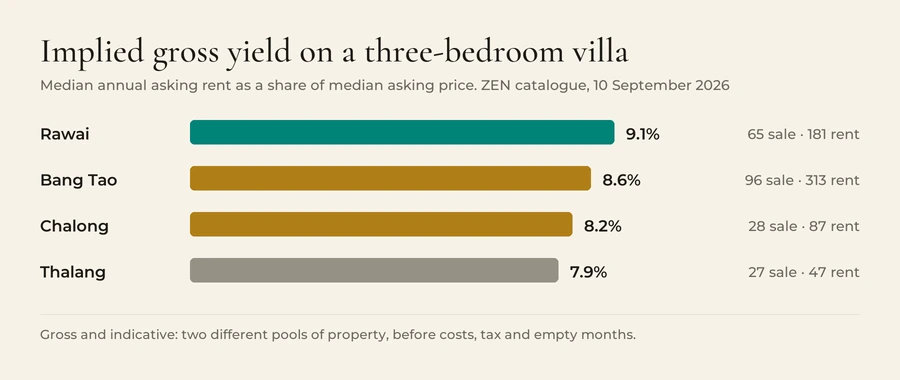
On a three-bedroom villa, Rawai implies 9.1% gross: a median asking price of ฿15.8m against a median asking rent of ฿120,000 a month, from 65 sale and 181 rental listings. Bang Tao implies 8.6% on a much bigger sample, Chalong 8.2%, Thalang 7.9%.
Now the part that gets left out of every other version of this ranking. Change the bedroom count and the order changes. On four-bedroom villas the same calculation gives Chalong 9.0%, Bang Tao 7.6% and Rawai 6.7% — Rawai goes from first to last. Rawai's strength is the three-bedroom family rental; its larger houses ask sale prices the rental market there does not support.
That is not a flaw in the data. It is the actual shape of the market, and it means "which district yields best" is an unanswerable question until you say what you are buying. If someone quotes you a district-level yield without a bedroom count attached, they have not done this arithmetic.
We went through the yield question in more depth in which Phuket areas actually deliver yield, and the costs that come off a gross figure are set out in every fee from offer to keys.
Ranked three: if you want to be able to sell it again
Bang Tao.
This is the ranking nobody asks for and everybody needs. Bang Tao holds 241 of the 689 sale listings on our book and 735 of the 1,847 rentals — 38.5% of all our priced, available stock in one district. Add Rawai's 22.0% and two districts account for more than three in every five listings on the island.
Depth cuts both ways, and it is worth being honest about both. Buying into a deep market means competing with a lot of similar stock when you come to sell, and Bang Tao's median asking price of ฿25.0m is the highest of any district with a real sample. But it also means there is a functioning market to sell into, a rental market ten times the size of Thalang's to cover you between owners, and comparable evidence for what your villa is worth. In a market with no public transaction record, comparable evidence is not a small thing.
Thalang and Pa Klok are the opposite case. Both ask ฿67,000–69,000 a square metre for large new-build villas, and both have thin rental books — 90 and 45 listings. A good buy at a fair price; a slower exit.
Ranked four: if you want the address
Kamala, with a warning about its own median.
Kamala has the most expensive square metre on the island at ฿105,000, and its median asking price of ฿35.0m is the highest in the table. Both figures are true and both are close to useless, because Kamala is not one market. Its 27 sale listings run from a ฿4.0m condominium to an ฿816m villa. Nine of the 27 are condominium units priced between ฿4m and ฿8.6m; the villas above them reach into the hundreds of millions. A median drawn across that is a number sitting in a gap where almost no property actually exists.
This is the general warning, and Kamala just shows it most clearly: the smaller the sample, the more a district median describes the listings rather than the district. Patong, Kata, Surin and Karon all fell below our fifteen-listing floor this month and are absent from the table for exactly that reason — not because they are bad places to buy.
The infrastructure argument, and why we are not ranking on it
You will be shown maps. The Kathu–Patong expressway and the Phuket light rail are both offered, routinely, as reasons to buy in a particular district now.
Here is what the Expressway Authority of Thailand publishes on its own project site. Phase 1, Kathu–Patong, is 3.98 km with twin tunnels; Phase 2, Muang Mai–Ko Kaeo–Kathu, is 30.62 km, for 34.60 km in total. The authority's own page records that Phase 1 reached the public-private partnership stage and that no private entity came forward during the tender period. Phase 2 has completed feasibility and detailed design. No construction start date is published on the authority's own project pages for either phase.
On the light rail we could not find a construction start date on a primary source at all — only news reports, which have carried a succession of different dates over several years. We are not printing any of them.
So our position is simple. Both schemes are real on paper. Neither is under construction. An area that will be well connected in 2032 is worth what it is worth today, plus whatever discount you think the delay risk deserves — and the honest read of a tender nobody bid on is that the risk is not small. Buy the villa, the location and the yield. If the tunnel arrives, treat it as a bonus you did not pay for.
So where should you actually buy
| If you are | Look first at | Because |
|---|---|---|
| Buying a three-bed to let | Rawai, then Bang Tao | Highest implied gross yield with a deep rental book behind it |
| Buying a four-bed to let | Chalong | The order reverses at four bedrooms — 9.0% against Rawai's 6.7% |
| Buying space to live in | Kathu, Chalong | Cheapest built square metre; Kathu's median villa is the largest on the book |
| Worried about resale | Bang Tao | 38.5% of all listings — a real market to sell into and real comparables |
| Buying a trophy | Kamala, Surin, Kata | Scarcity is the asset; ignore district medians entirely at this end |
| Buying new-build with a long horizon | Thalang, Pa Klok | Large modern villas at ฿67,000–69,000 per m²; accept a slower exit |
Live counts and entry prices for every district sit on the districts page, and each area's current stock is one click further in — Rawai, Bang Tao, Chalong. If you are looking at new developments rather than resale, the projects list is the right starting point.
One closing caveat, and it is the same one we opened with. These are eight medians on one day. They move. We now take a dated snapshot of the whole catalogue on every publishing run, so the next version of this article will be able to say what changed rather than asserting a trend — but this one cannot, and does not.
If you would rather not do this arithmetic yourself, the buyer questionnaire takes about two minutes and gets you a shortlist against your actual budget and purpose, from the same book these figures came from.